Analysis: Shumlin Needs Support Of Centrists, Environmentalists

ANGELA EVANCIE/VPR
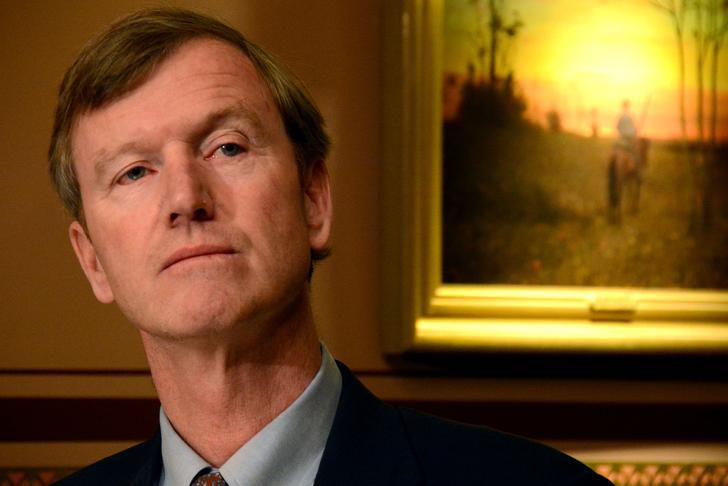
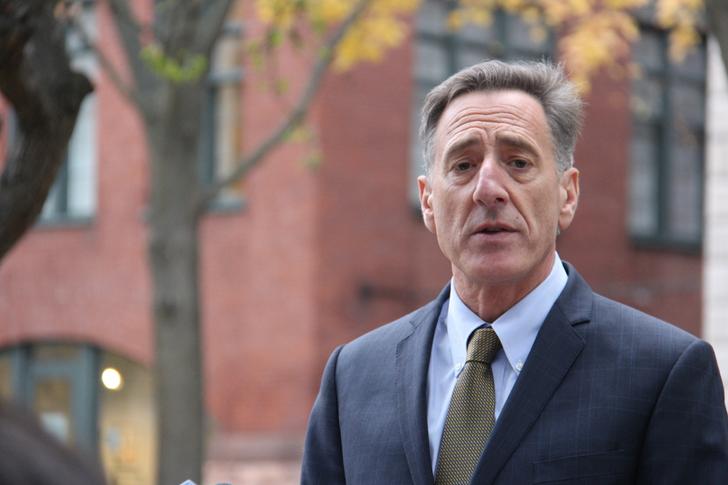
Final results showed that Gov. Peter Shumlin received roughly 2,400 more votes than Republican challenger Scott Milne. Find statewide and local results here.
| Governor | |||
|---|---|---|---|
| Candidate | Party | Votes | % of Vote |
| Peter Shumlin | Dem | 89,883 | 46.43% |
| U.S. House, District 1 | |||
|---|---|---|---|
| Candidate | Party | Votes | % of Vote |
| Peter Welch | Dem | 123,896 | 64.39% |
| Lieutenant Governor | |||
|---|---|---|---|
| Candidate | Party | Votes | % of Vote |
| Phil Scott | GOP | 119,942 | 62.28% |
| Secretary of State | |||
|---|---|---|---|
| Candidate | Party | Votes | % of Vote |
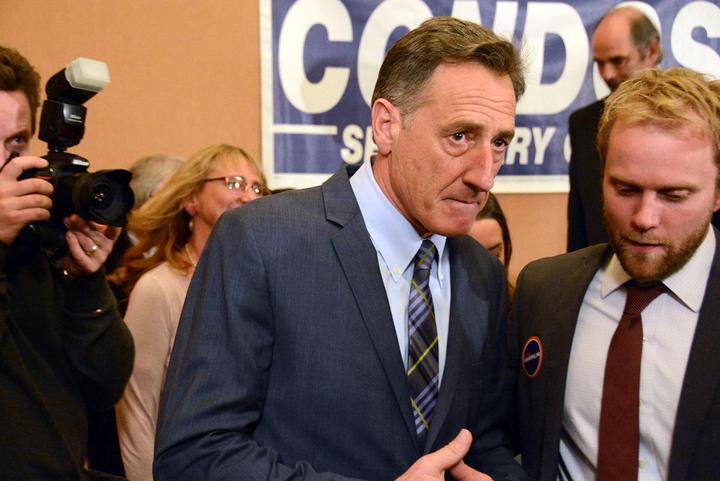
| Jim Condos | Dem | 126,973 | 74.83% |
| Attorney General | |||
|---|---|---|---|
| Candidate | Party | Votes | % of Vote |
| William Sorrell | Dem | 109,826 | 58.63% |
| Treasurer | |||
|---|---|---|---|
| Candidate | Party | Votes | % of Vote |
| Beth Pearce | Dem | 124,925 | 74.55% |
Results as reported by the Associated Press


Democratic incumbent Peter Shumlin, Republican Scott Milne, Libertarian Dan Feliciano and Liberty Union candidate Peter Diamondstone met for a debate moderated by VPR's Jane Lindholm and Bob Kinzel on Tuesday, Sept. 23. Listen here.
Three videos that explain the issues, in under 90 seconds each.
What You Need To Know About Campaign 2014
The 2014 Lieutenant Governor's Race
Money In Vermont Politics
Use this tool to find out what races are on your local ballot.
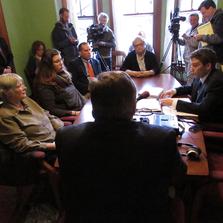
Updates from the polls, election results, analysis and photos from VPR reporters in the field.